Your cart is currently empty!
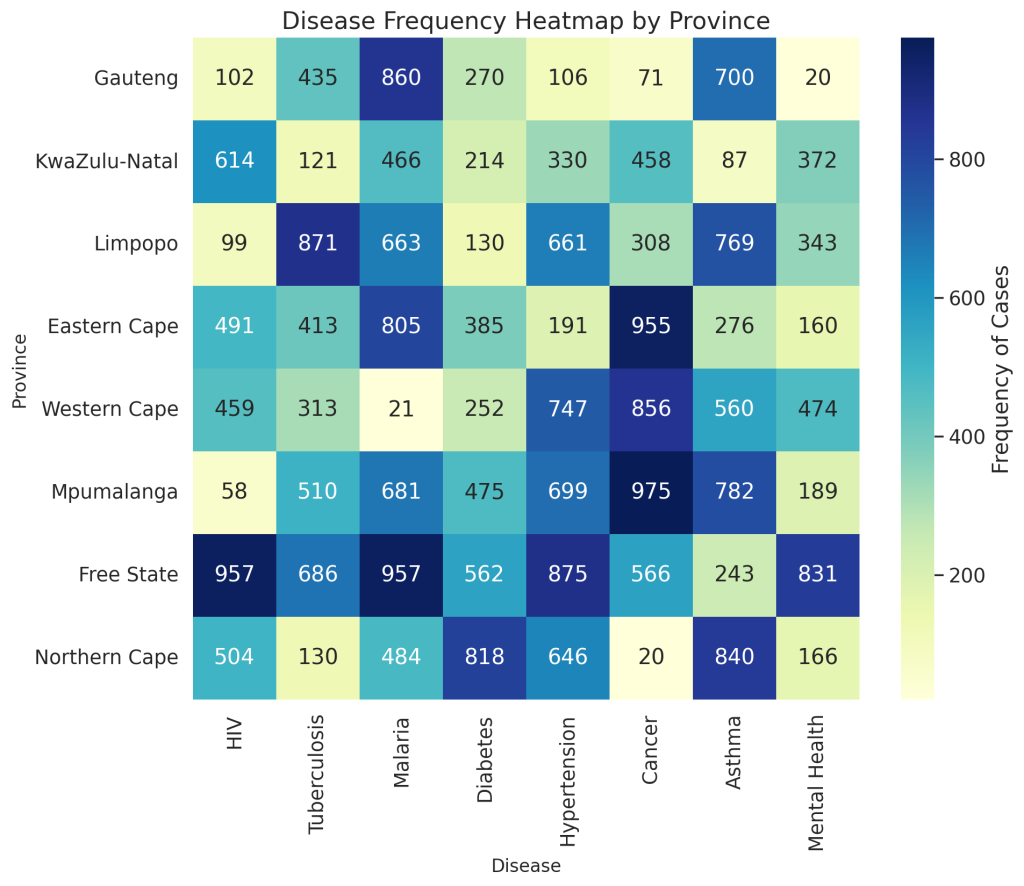
SayPro Disease Frequency Heat Map
Step-by-Step: Uploading Weekly Progress Heatmaps
1. Generate Heatmaps
- Use data visualization tools (Excel, Python/Matplotlib/Seaborn, Power BI, etc.) to generate the weekly heatmaps.
- Ensure each heatmap is labeled with the correct date range (e.g.,
Week 19: Apr 28–May 4).
2. Save Files in Compatible Format
- Save each heatmap as a PNG, JPEG, or interactive HTML (if supported by the dashboard).
- Suggested file naming convention:
progress_heatmap_YYYY_MM_DD.png.
3. Log into SayPro’s Dashboard Admin Panel
- Use your SayPro credentials to access the interactive dashboard management portal.
4. Navigate to the Upload Section
- Locate the section labeled “Weekly Progress”, “Data Visualizations”, or similar.
- Click Upload or Update Widget (depending on the dashboard design).
5. Upload and Link the Heatmap
- Drag and drop the saved heatmap file or use the file picker.
- If it’s an interactive heatmap, use the HTML embed/upload feature if available.
6. Tag and Describe
- Add metadata such as:
- Title:
Weekly Progress Heatmap – Week 19 - Tags:
heatmap,progress,week_19,May_2025 - Short description of what the heatmap visualizes.
- Title:
7. Save and Publish
- Click Save Changes or Publish to make it live on the dashboard.
- Confirm visibility and test responsiveness if it’s interactive.
8. Confirm Upload Success
- Refresh the dashboard and verify the heatmap appears in the correct section.
- Optionally notify stakeholders (e.g., via internal SayPro Teams channel or email).
Leave a Reply
You must be logged in to post a comment.